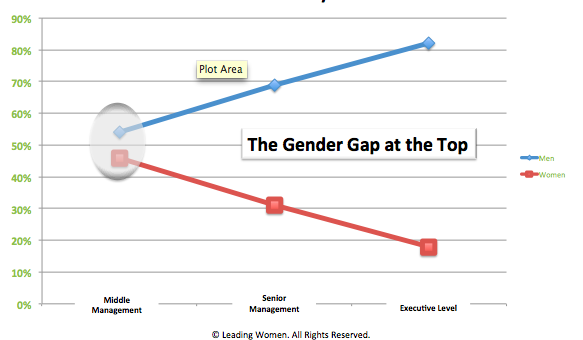
Which organization has the greater challenge when it comes to closing the gender gap at the top?
Company 1: with 60% women in the workforce and 27% at the top,
or
Company 2: with 16% at the top and 22% in the workforce?
This is a question that our colleague, Pascale Thorre, Head of Global Diversity and Inclusion at Nokia (formerly Global Diversity Director at Alcatel-Lucent); was seeking to answer when she developed a metric that would enable organization-to-organization comparisons. It doesn't matter if the organization in question is an enterprise, a business unit or a function.
As Pascale writes in her blog on My Strategic Analysis for Gender Diversity,
"Most diversity reports are disclosing the % of women in the workforce, and the % of women amongst leaders. Companies hiring from engineering pools where women are scarce look diversity-adverse through these lenses...Using the Female Capital Gap metric, one can benchmark companies’ ability to leverage their male and female talent."
The Female Capital Gap is her solution, comparing a situation where the % of women at the top would equal the % of women in workforce, with the current situation. Here's how it's calculated. You take the difference between the percentage of women in the workforce and the percentage of women at the top. Then divide that by the percentage of women in the workforce.
In our examples:
Company 1 has a Female Capital Gap of 55%
60% - 27% = 33% then divided by 60%
Company 2 has a Female Capital Gap of 27%
22% - 16% = 6% then divided by 22%
This is important because it tells us that Company 1 has a greater challenge in terms of advancing women even though their percentage of women at the top is twice that of Company 2.
This doesn't let Company 2 off the hook. It may have a limited recruitment pool or a recruitment process that could be strengthened.
AMEX's Chief Diversity Officer, Valerie Grillo, recently highlighted the improvement in the % of women executives at AMEX. The percent moved from 37% to 39%. She mentions that the workforce now is 60% women for a Female Capital Gap of 35% - not insignificant.
How Bad Are the Tech Companies, Really?
Recently, the tech companies have taken a big hit when it comes to gender diversity. Looking at the stats, we see based on the numbers of women as a percentage of the overall workforce that the pipeline of talent into the companies is a challenge, but the FCG at the top isn't as bad as it might appear.
Yahoo released stats that 37% of its workforce is women with 23% of "leadership" positions held by women. Female Capital Gap (FCG) of 23%
If we read their post correctly, Facebook has a workforce that's 31% women and 23% of "senior positions" held by women. FCG = 26%
At Google 30% of the workforce is women, 21% of leadership. FCG = 30%
For LinkedIn the stats are 39% of the workforce and 25% of "leadership". FCG = 36%
At Microsoft the workforce is 29% women and 17.3% of "leadership" is women. FCG = 40%
Granted, we don't know how these companies are defining "leadership" or "senior positions" so even these statistics may not be comparing apples to apples, but it is interesting to note that LinkedIn with the highest reported percentage of women in "leadership" has one of the biggest Female Capital Gaps.
That said, in contrast to the FCG at AMEX (35%) - which consistently ranks as a great place for women to work by outside organizations such as the LATINAStyle 50 Best Companies for Latinas, The Top 50 Employers for Women Engineers, and The Top 50 Companies for Female Executives by NAFE - the tech companies' FCGs are about the same or better! Who would have guessed?
Using FCG to Pinpoint Challenges
The Female Capital Gap can also be used to pinpoint challenges at key transition points, for example between management and senior management. Recently, in writing about its gender diversity initiatives from the frontline to the boardroom, AT&T published its statistics on this transition, "37% of our managers and 29% of our senior leaders are women." This represents a Female Capital Gap of 22%.
What are your organization's Female Capital Gaps? Do you look business unit by business unit or function by function or do you look at the overall picture? AND at which transition point(s) does your gap begin to manifest.
When it comes to designing interventions that make a difference, these are powerful questions to ask because, in the final analysis, a goal for any company would be to have a 0% Female Capital Gap at all levels.
Thank you, Pascale, for this excellent new tool in the field of diversity & inclusion and for closing the leadership gender gap!
Interested in calculating your FCGs? We've created a FCG calculator for you below!


